Data Health
To understand the health of your data, you need to know whether tests are passing or failing as well as what you're testing and how often.
Metrics
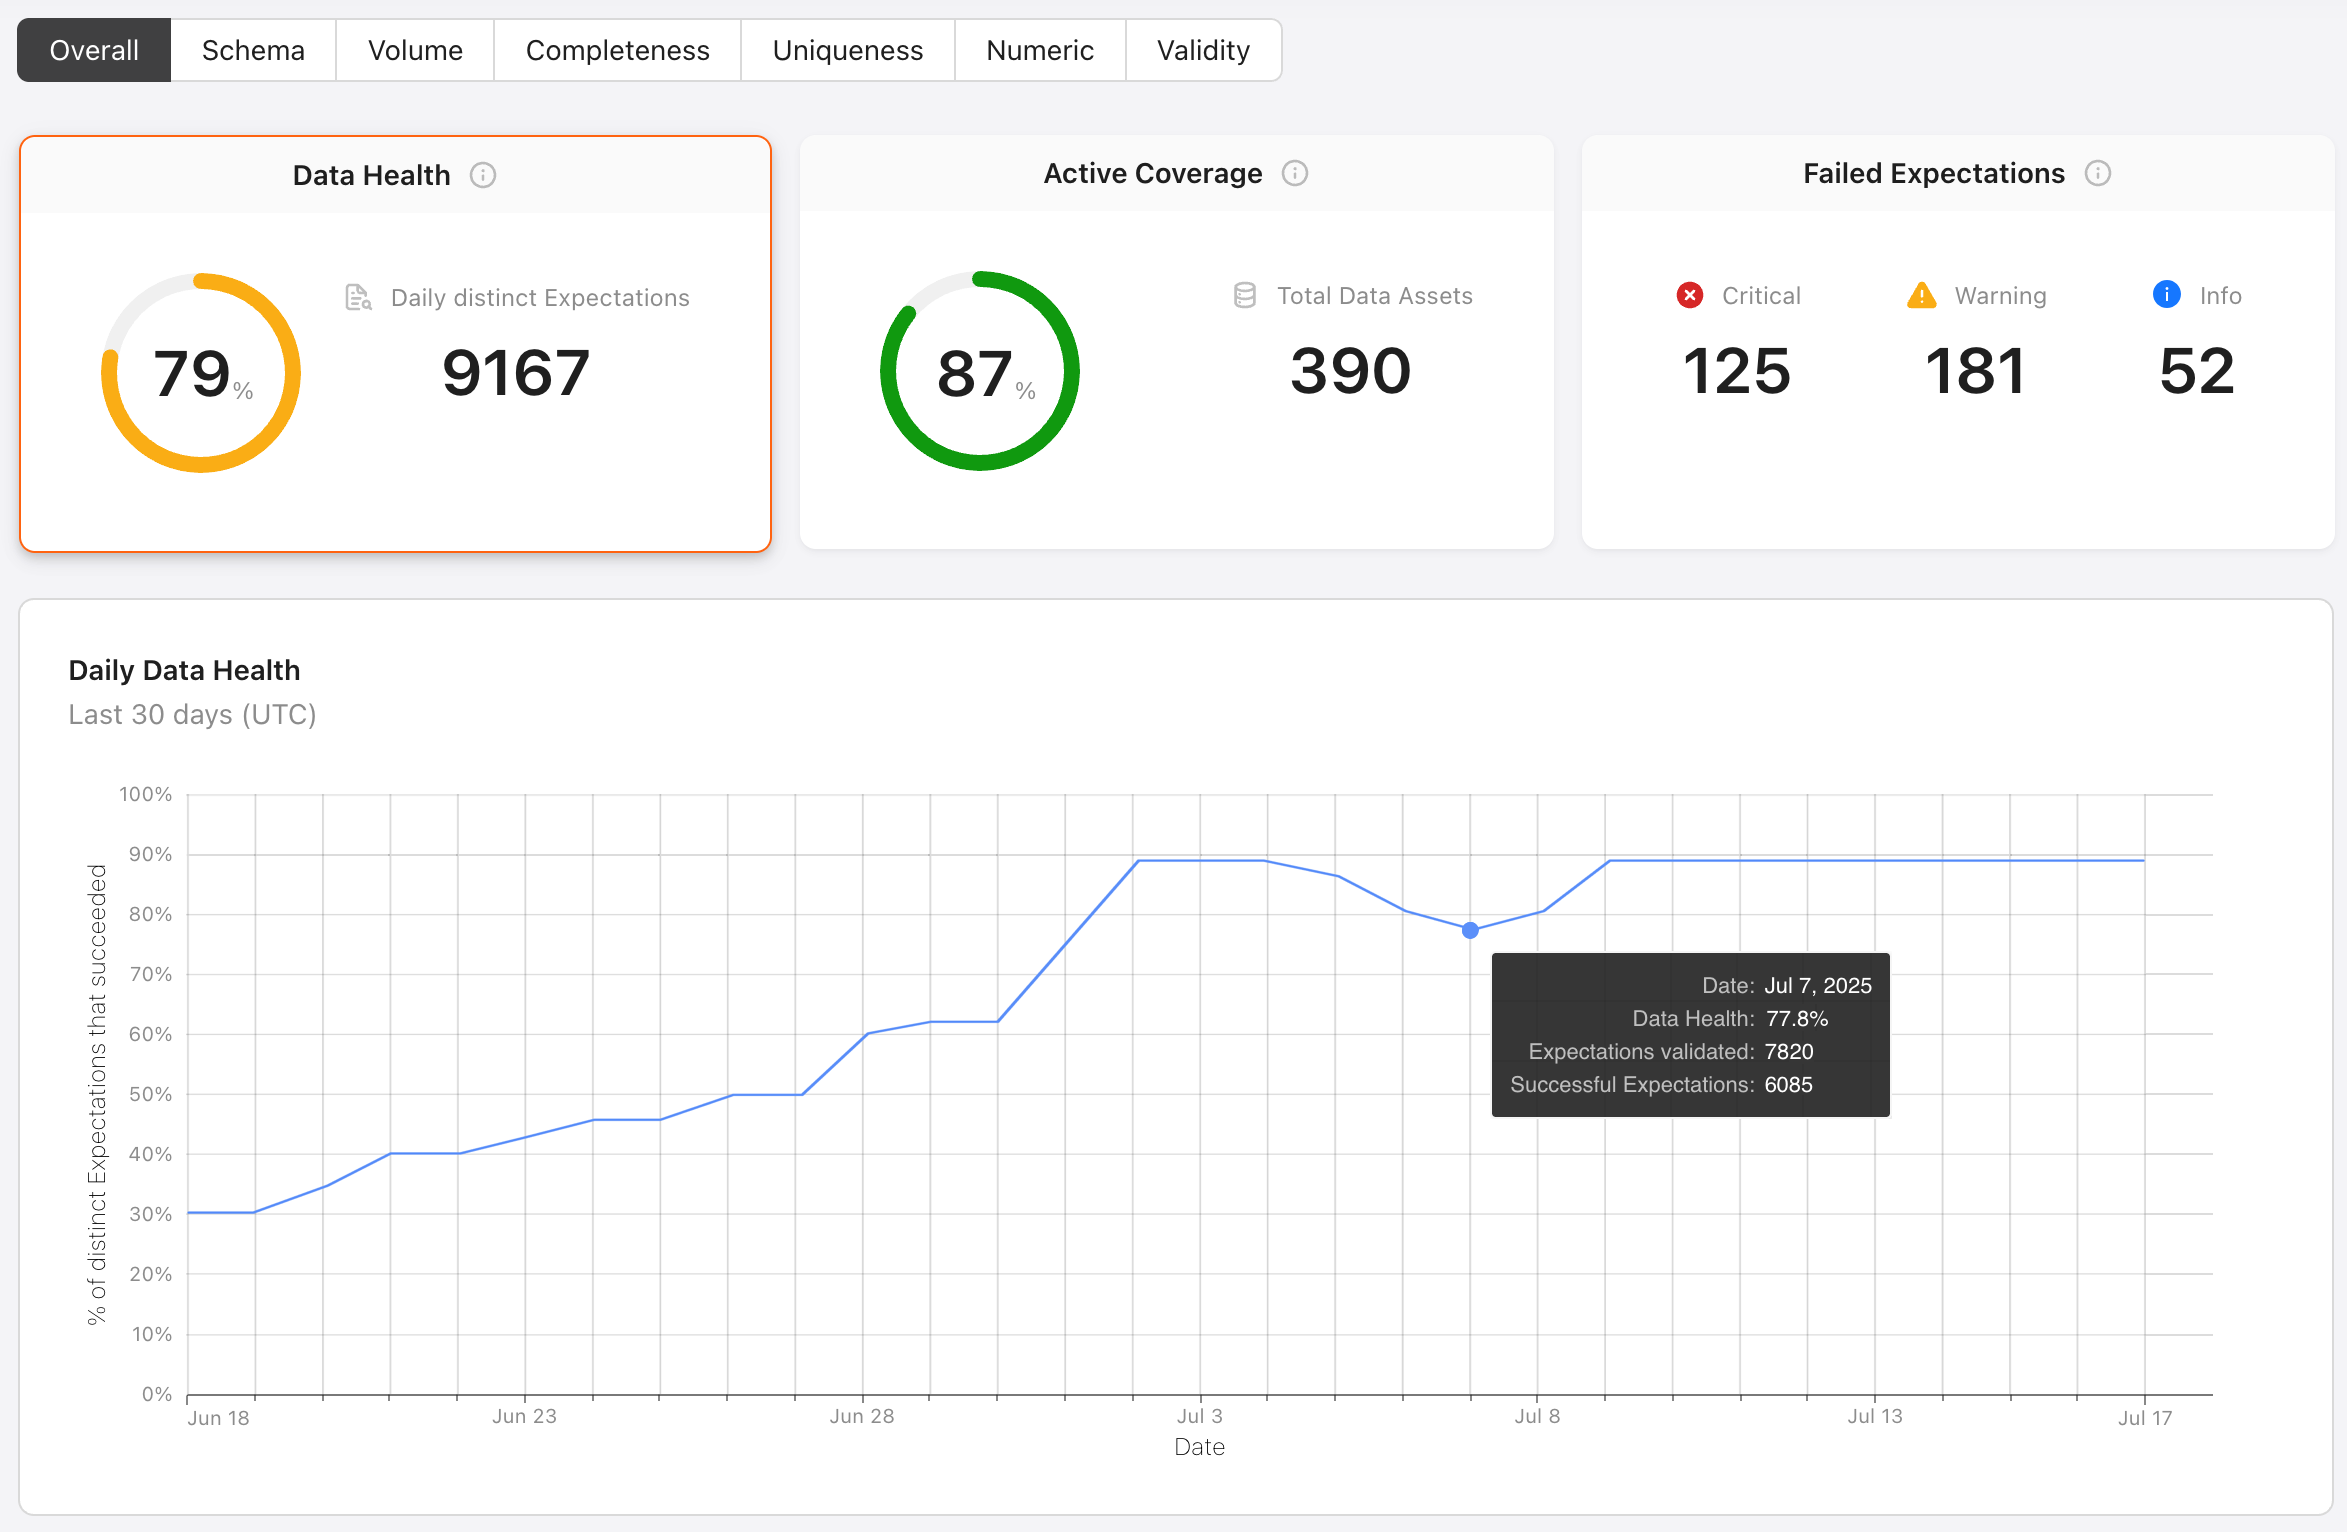
To give you these insights into the health of your data, GX Cloud provides the following workspace-level metrics on the Data Health page:
-
Data Health: A 30-day average of the following daily percentage: the number of successful distinct Expectations in a day divided by the number of distinct Expectations validated in that day. Here are some scenarios to help you understand the concepts of distinct Expectation validations and successful distinct Expectations as used in calculating data health metrics.
- If an Expectation is validated multiple times for a given Data Asset in a single day, it will be counted as one distinct Expectation validation.
- If an Expectation fails near the start of the day and succeeds near the end of the day, it will be counted as a successful distinct Expectation.
- If an Expectation succeeds near the start of the day and fails near the end of the day, it will not count as a successful distinct Expectation.
-
Daily distinct Expectations: A 30-day average of the number of distinct Expectations validated each day.
-
Daily Data Health: The number of successful distinct Expectations in a day divided by the number of distinct Expectations validated in that day.
-
Active Coverage: The percentage of Data Assets that have been validated in the last 30 days.
-
Total Data Assets: The current number of Data Assets in your GX Cloud workspace.
-
Failed Expectations: The number of distinct Expectations that have failed on their most recent run in the last 30 days. This metric is faceted by failure severity into separate counts for Critical, Warning, and Info.
Days as used in these metrics are segmented by midnight UTC.
Only current Data Assets and Expectations are considered in these metrics. Deleted Data Assets and Expectations are excluded from the calculations even if they've had Validations within the last 30 days.
Filters
For a more nuanced understanding of the health of your data, you can filter the Data Health dashboard to focus on specific entities (Data Sources, Data Assets, or Columns) and/or a specific data quality issue (such as Schema or Volume).
Entity filters
An entity filter can be an exact match or a partial match. For example, you can filter the dashboard to calculate metrics from a single specific Data Source or from all Data Sources that contain a given string in their names.
When you apply an entity filter, all metrics are calculated from just the matching entities. For example, if you filter to Columns containing a given string in their names, then Active Coverage will be the percentage of Data Assets with at least one matching column that have been validated with at least one Expectation on a matching column in the last 30 days.
Keep the following limitations in mind when working with column filters:
-
If a Data Asset has not been profiled, its columns won’t be available to the entity filter.
-
The following Expectations are not associated with any specific columns, so they will be excluded from calculations when a column filter is applied.
- Expect query results to match comparison
- Expect table column count to be between
- Expect table column count to equal
- Expect table row count to be between
- Expect table row count to equal
- Expect table row count to equal other table
- Custom SQL Expectation
Data quality issue filters
When you apply a data quality issue filter, such as Completeness, the metrics shown are impacted as follows:
- For Data Health, Daily distinct Expectations, Daily Data Health, Failed Expectations, and Most frequently failed Expectations, only Expectations belonging to the selected data quality issue will be considered in calculations.
- The Active Coverage percentage will be scoped to Data Assets that have been validated with at least one Expectation for the selected data quality issue in the last 30 days.
- The number of Total Data Assets will not change. This continues to show the number of Data Assets in your GX Cloud workspace that match any entity filters you’ve applied, regardless of what data quality issues you are testing on those Data Assets.
If you apply both an entity filter and a data quality issue filter, the filters will be compounded. For example, if you apply a Column filter and select the Schema data quality issue, then Active Coverage will indicate the percentage of Data Assets with matching columns that have been validated with at least one schema Expectation on a matching column in the last 30 days.
Next steps for improving data health
If Active Coverage is low, drill into it for a list of Inactive Data Assets. Then schedule recurring Validations and/or add Expectations for those Data Assets to improve your coverage both overall and for specific data quality issues.

If Failed Expectations are high, drill into Critical, Warning, or Info for a severity-specific list of the Most frequently failed Expectations. Then click on Expectations of interest to explore their Validation results so you can determine what action to take. You may find that there are issues in your data pipeline that need to be resolved, or you may find that you need to adjust your Expectations.
